
JUNE 27, 2025
Inside Anura
A technical deep dive into ReVibe’s latest developments for our closest ones.
Hi,
Welcome to Inside ANURA, where we share key technical updates on our products, and ongoing improvements.
Take part of the latest news from the tech team, including:
- New product development
- Updates on existing products
- Upcoming events & activities
New product development
Ongoing development and future releases shaping the next-generation of our products.
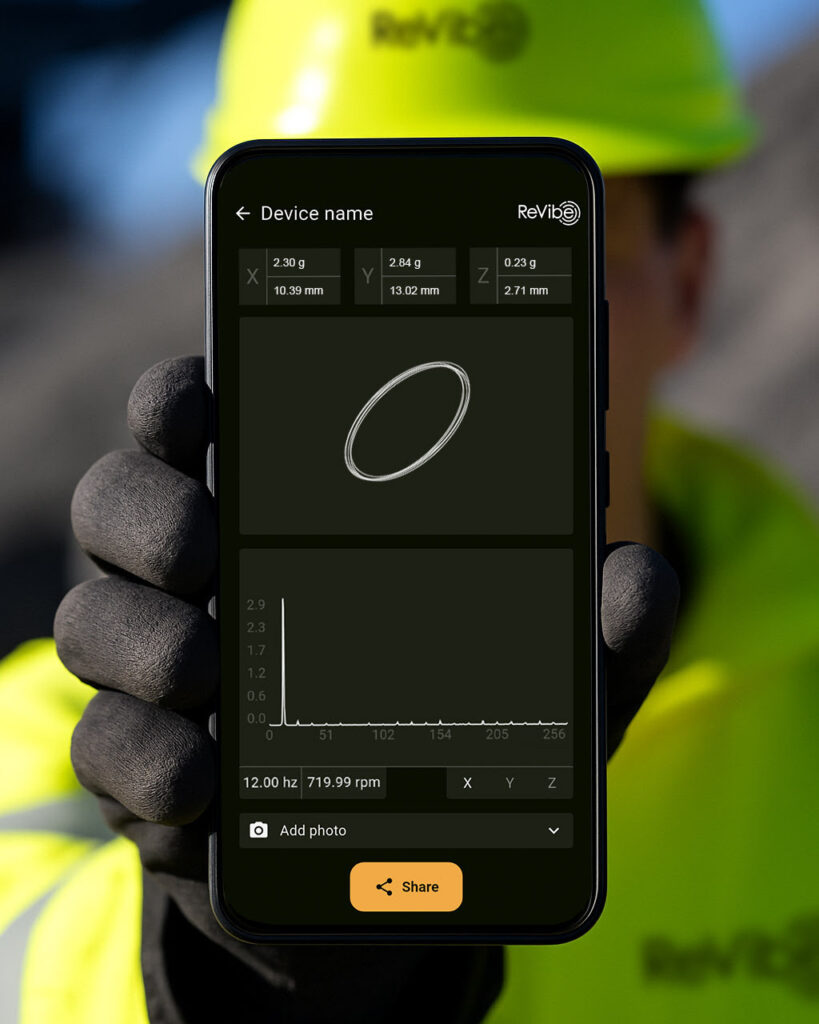
Mobile app development: ANURA Connect
We’re working on a new app for iOS and Android that makes it easy to visualize sensor data from a single sensor. Both VS10-C and VS1 use the same communication protocol, so you can connect to either.
The app lets you:
- View real-time sensor data
- Take a picture of the connected sensor and associate it with the measurement
- Share the collected data, the photo and a .vibe file via email
The .vibe file can be opened in the Vibreshark desktop application for further analysis. The ANURA Connect app is designed to be white-labeled upon request.
Updates on existing products
Enhancements, fixes, and new features introduced since the last update.
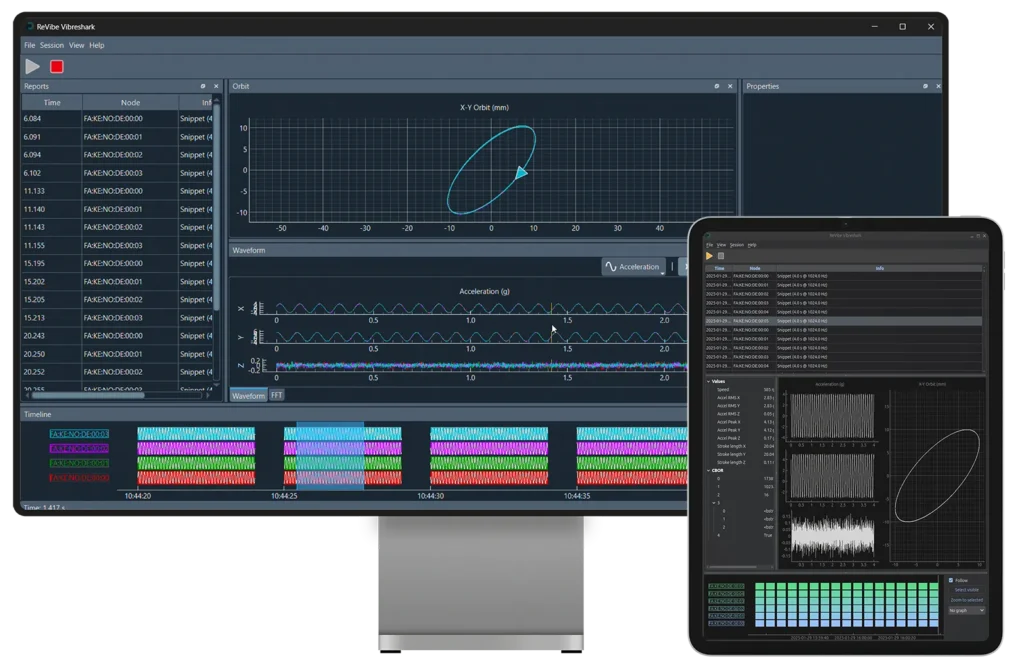
Vibreshark (Data acquisition and diagnostics software for PC)
Version 0.24 has been released and you’ll find it here.
What’s New
- Copy and paste from the Property Table view. You can now select a portion of the Property Table view and paste it in apps like Word or Excel. Ctrl+C supported!
- Extended export function. A new export dialog lets you export data from multiple sensors in one go. Make a selection in the Timeline, then click File → Export… in the menu.
- Plane selector in the Orbit view. A selector lets you choose which plane (XY, YZ, or XZ) to display in the Orbit view.
- Diversity in unit preferences. Choose between meter, millimeter, and inch for displacement; m/s, and ft/s for velocity; m/s², ft/s², and g for acceleration; and between Hz and rpm for frequency.
Improvements
- Don’t lose track of the signal. The Waveform view behavior has been modified to prevent losing the signal when panning, zooming and changing signal selection.
- Show clipped parts of velocity and displacement. When we filter and integrate acceleration to produce velocity and displacement signals we must cut some parts off. Instead of hiding the clipped parts we now show them in a muted color in the Waveform view.
- Filter out irrelevant Bluetooth devices. Finding your sensor is easier now that we filter everything that is not an ANURA sensor.
- Auto-ranging in the FFT view. We have changed the FFT view to automatically adapt the range of the Y axis to the displayed data. Manual zooming and panning is still enabled for the X axis but appropriate limits have been set to help you avoid getting lost in the vastness of the cartesian plane.
- Property Table to the forefront. In this release we have decided to promote the Property Table view and move the old Property view to the back of the tab stack. The Property view no longer displays vibration/motion parameters as those are displayed in the Property Table. The Property view will continue to evolve into more of a technical behind the scenes tool, useful for developers integrating with our sensors, but of less importance to users making measurements.
- Consistent use of plot colors. Plot colors are now guaranteed to be used consistently between different views. The work behind the scenes for this change will be instrumental to implement some of the most requested features, like the ability to make intelligent comparisons between sensors and assigning names to sensor positions.
Bug fixes
- Fixed: Opening .vibe files containing aggregates reports will not break any functionality. Note: This fix does not include actual support for aggregates reports.
- Fixed: Buffered reports stored in the sensor are now skipped when connecting with the direct Bluetooth option.
VS10-C (Battery-Powered Sensor)
- Carrying cases for both 4- and 8-sensor field diagnostics kits are now available
- Second production batch of VS10-C is underway
SB1 (Sensor Bridge to Modbus)
The SB1 can now be updated via a web interface. This is currently being evaluated together with selected field test customers.
Features:
- Aggregated values calculated in the sensor node sent via Modbus TCP
- Power over Ethernet (PoE)
The SB1 is now available for early access customers.
Use case example for the SB1:
An end-customer wants to monitor catastrophic screen failures, such as a broken or slipping timing belt. When this occurs, it’s critical to shut off the upstream feed — up to 150 tons per hour — to avoid downstream chaos.
With the SB1, data like RMS values and stroke length (XYZ) can be polled directly from a PLC. Rules and alarm conditions can then be configured in the PLC to automatically trigger warnings or shutdowns when thresholds are exceeded.

TR11-USB Transceiver
The TR11-USB has now been officially released. It provides access to time-synchronized data from VS1 and VS10-C sensors and can be used directly with applications like Vibreshark. The TR11-USB also allows developers to build their own software tools that interact with our sensors — making it ideal for custom integrations and advanced use cases. The transceiver comes with a specially designed and individually tuned antenna for reliable wireless performance.
We’re currently preparing developer documentation to support integration with TR11-USB. If you’re building your own application, let us know as we have an early draft of the documentation available.
VS1 self-powered vibration sensor
We’ve added several new aggregated values to the VS1, and updated existing ones. Currently, these values are consumed primarily by the SB1 (Sensor Bridge to Modbus TCP), but they can also be used by gateways and sent to backend systems, making them useful in a wider range of setups.
New and updated aggregated values include:
- Root mean square (RMS) amplitude of acceleration – X, Y, Z (m/s²)
- Peak amplitude of acceleration – X, Y, Z (m/s²)
- RMS amplitude of velocity – X, Y, Z (m/s)
- Peak amplitude of velocity – X, Y, Z (m/s)
- Peak-to-peak displacement – X, Y, Z (m)
- Planar stroke (Method A) – XY, YZ, XZ (m)
- Planar stroke (Method B) – XY, YZ, XZ (m)
- Frequency of highest spectral peak – X, Y, Z (Hz)
- Crest factor of acceleration – X, Y, Z
These values are calculated directly on the sensor using synchronized aggregation windows. The windows are non-overlapping and gapless, making monitoring using aggregated values truly continuous in the sense that there are no blind periods. The aggregation interval can be set between 1 and 60 seconds and defines both the time window used for calculations and how often values are sent.
Advantages of on-sensor (“edge”) aggregation:
- Enables truly continuous monitoring
- Reduces data transmission needs
- Provides a solid foundation for setting alarm/trigger thresholds
If you’re interested in using aggregated data for monitoring or control applications, feel free to reach out — we’d be happy to discuss your use case.
Anura Gateway Development
We’ve made updates to our dockerized gateway for one of our major screen manufacturer customers. The latest development includes FOTA (Firmware Over-the-Air) support for both transceivers and sensors, handled directly through the dockerized gateway.
Documentation & Support
We’ve recently made several improvements to our support and documentation resources:
- New support channel. We’ve launched a dedicated support email — [email protected] — backed by a proper ticketing system. We’re gradually moving all customers to this method and will contact you when it’s time.
- Updated documentation center. Standards and capabilities are now listed per product for easier reference.
- ROI calculator for end-users. A simple return-on-investment calculator is now available.
- AVSS protocol documentation. Our proprietary protocol for sensor communication is documented internally. It’s not public, but we’re happy to share it upon request.
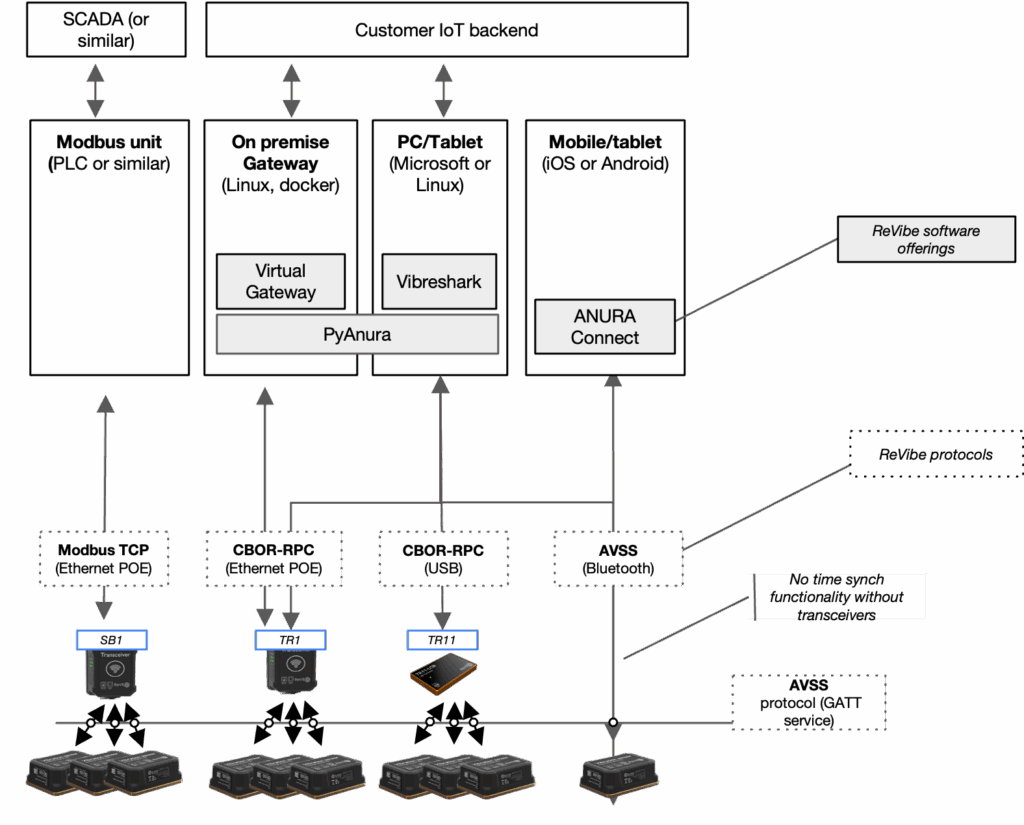
- System overview diagram. A diagram to describe how the different components of the platform are linked together:
Production / Operations
We’ve installed a new large-format 3D printer in the workshop at our Gothenburg office, primarily for rapid prototyping and iterative product development.
The first production batch of the VS10-C has been completed, and we’ve developed new test rigs to support scaling and quality assurance going forward.
Technology Use-Cases / Learning Center
We’ve launched a new Learning Center on the website, aimed at explaining how our technology works — with a special focus on real-world use cases where it brings the most value. So far, we’ve published two articles:
- Understanding vibration energy harvesting
- Why time synchronization is critical for vibration sensors
Activities & events
Where we’ve been recently — and where we’re heading next.
Events we’ve attended in 2025:
This spring, we participated in several key industry events, including AGG1 (St. Louis, USA), Bauma (Munich, Germany), Expomin (Santiago, Chile), and CIM Connect (Montréal, Canada). These events gave us the chance to meet with customers, partners, and resellers — and to showcase how our technology supports more effective vibration monitoring and diagnostics.
Upcoming event:
We’re planning to exhibit at the International Mining and Resources Conference (IMARC) in Sydney, Australia 🇦🇺 (October 21–23). Business Sweden is organizing a Swedish Pavilion, and ReVibe will be one of the participating companies.
That’s it for this edition of Inside Anura. Stay tuned for more updates, and as always, feel free to reach out with feedback or questions!
All the best,
Tomas Gabinus
CEO at ReVibe