
Vibration analysis made simple
Making sense of your vibration measurements
To help you analyze and interpret your vibration measurements, we have developed VibInspect. VibInspect is a free software that allows you to perform a range of different analyses of your vibration data, or to convert the measurement data you have acquired with the ReLog to a file format you can use in your own system.
Included features
- Visualize the vibration data you have recorded with the ReLog to better understand your machines and other assets
- Calculate frequency content of the recorded vibrations
- Merge measurements and trim unwanted portions
- Export to other file formats
- Set measurement settings of the ReLog prior to recording vibrations
Included analysis possibilities:
- PSD
- FFT
- Spectogram
- Histogram
- Orbit plot
- Octave spectrum
- Cursors for highlighting important features in spectrums, including fault frequency indication for:
- Bearings
- Gearboxes
- Belts & pulleys
- Electric motors
- Pumps/fans
Highlighted feature:
Machine Health diagnostics
With the help of VibInspect, you can with ease analyse the condition of your machines and assets. By using VibInspect, you can utilise cursors to highlight fault frequencies in the following type of machines and components:
- Bearings
- Gearboxes
- Belts & pulleys
- Electric motors
- Pumps/fans
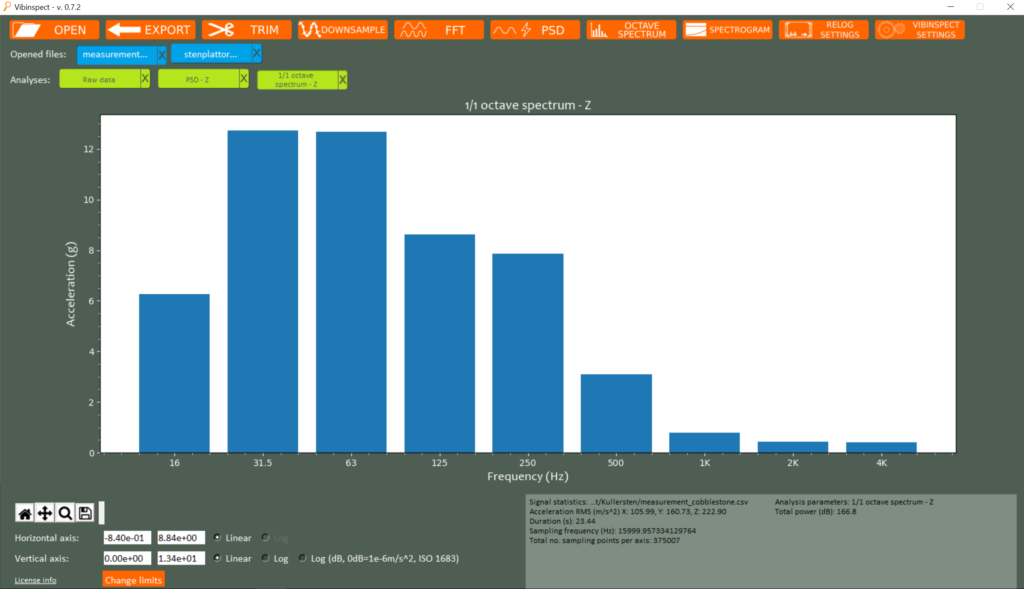
Octave spectrum for acoustic analysis
With VibInspect, you can even analyse your measurements using the octave spectrum filters, where you can choose between 1/1 and 1/3 octave spectrums
Highlighted feature:
Orbit plot analysis
Use orbit plots to monitoring the operating behavior of vibrating screens or other rotating machinery. Using an orbit plot analysis from a healthy machine gives you a reference when performing future measurements. The orbit plot analysis can help to detect:
- Unbalance
- Broken springs
- Uneven feeding across the screen media
- Etc.
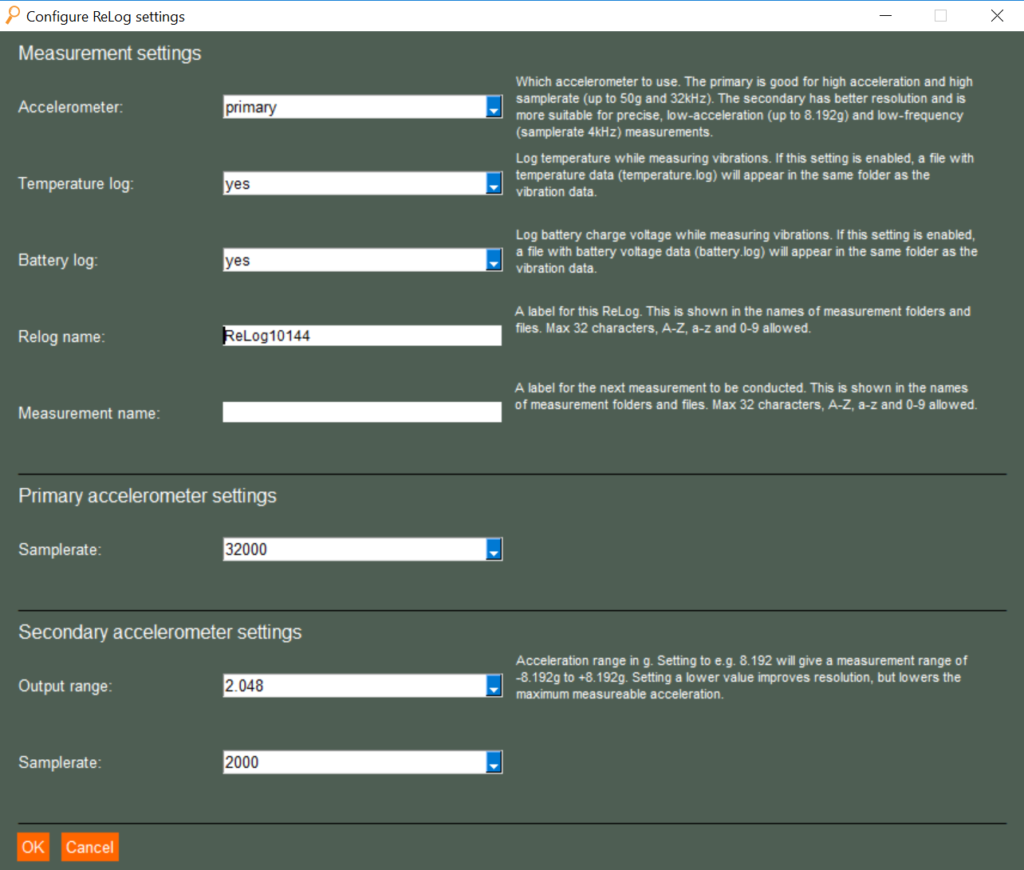
Configure ReLog sample rate
Through a simple interface, you can easily change the sample rate of your ReLog(s) before using them in the field. Set your sample rate to any level between 0 – 32,000 Hz, change between the primary and secondary accelerometer, and enable temperature measurements.
Highlighted feature:
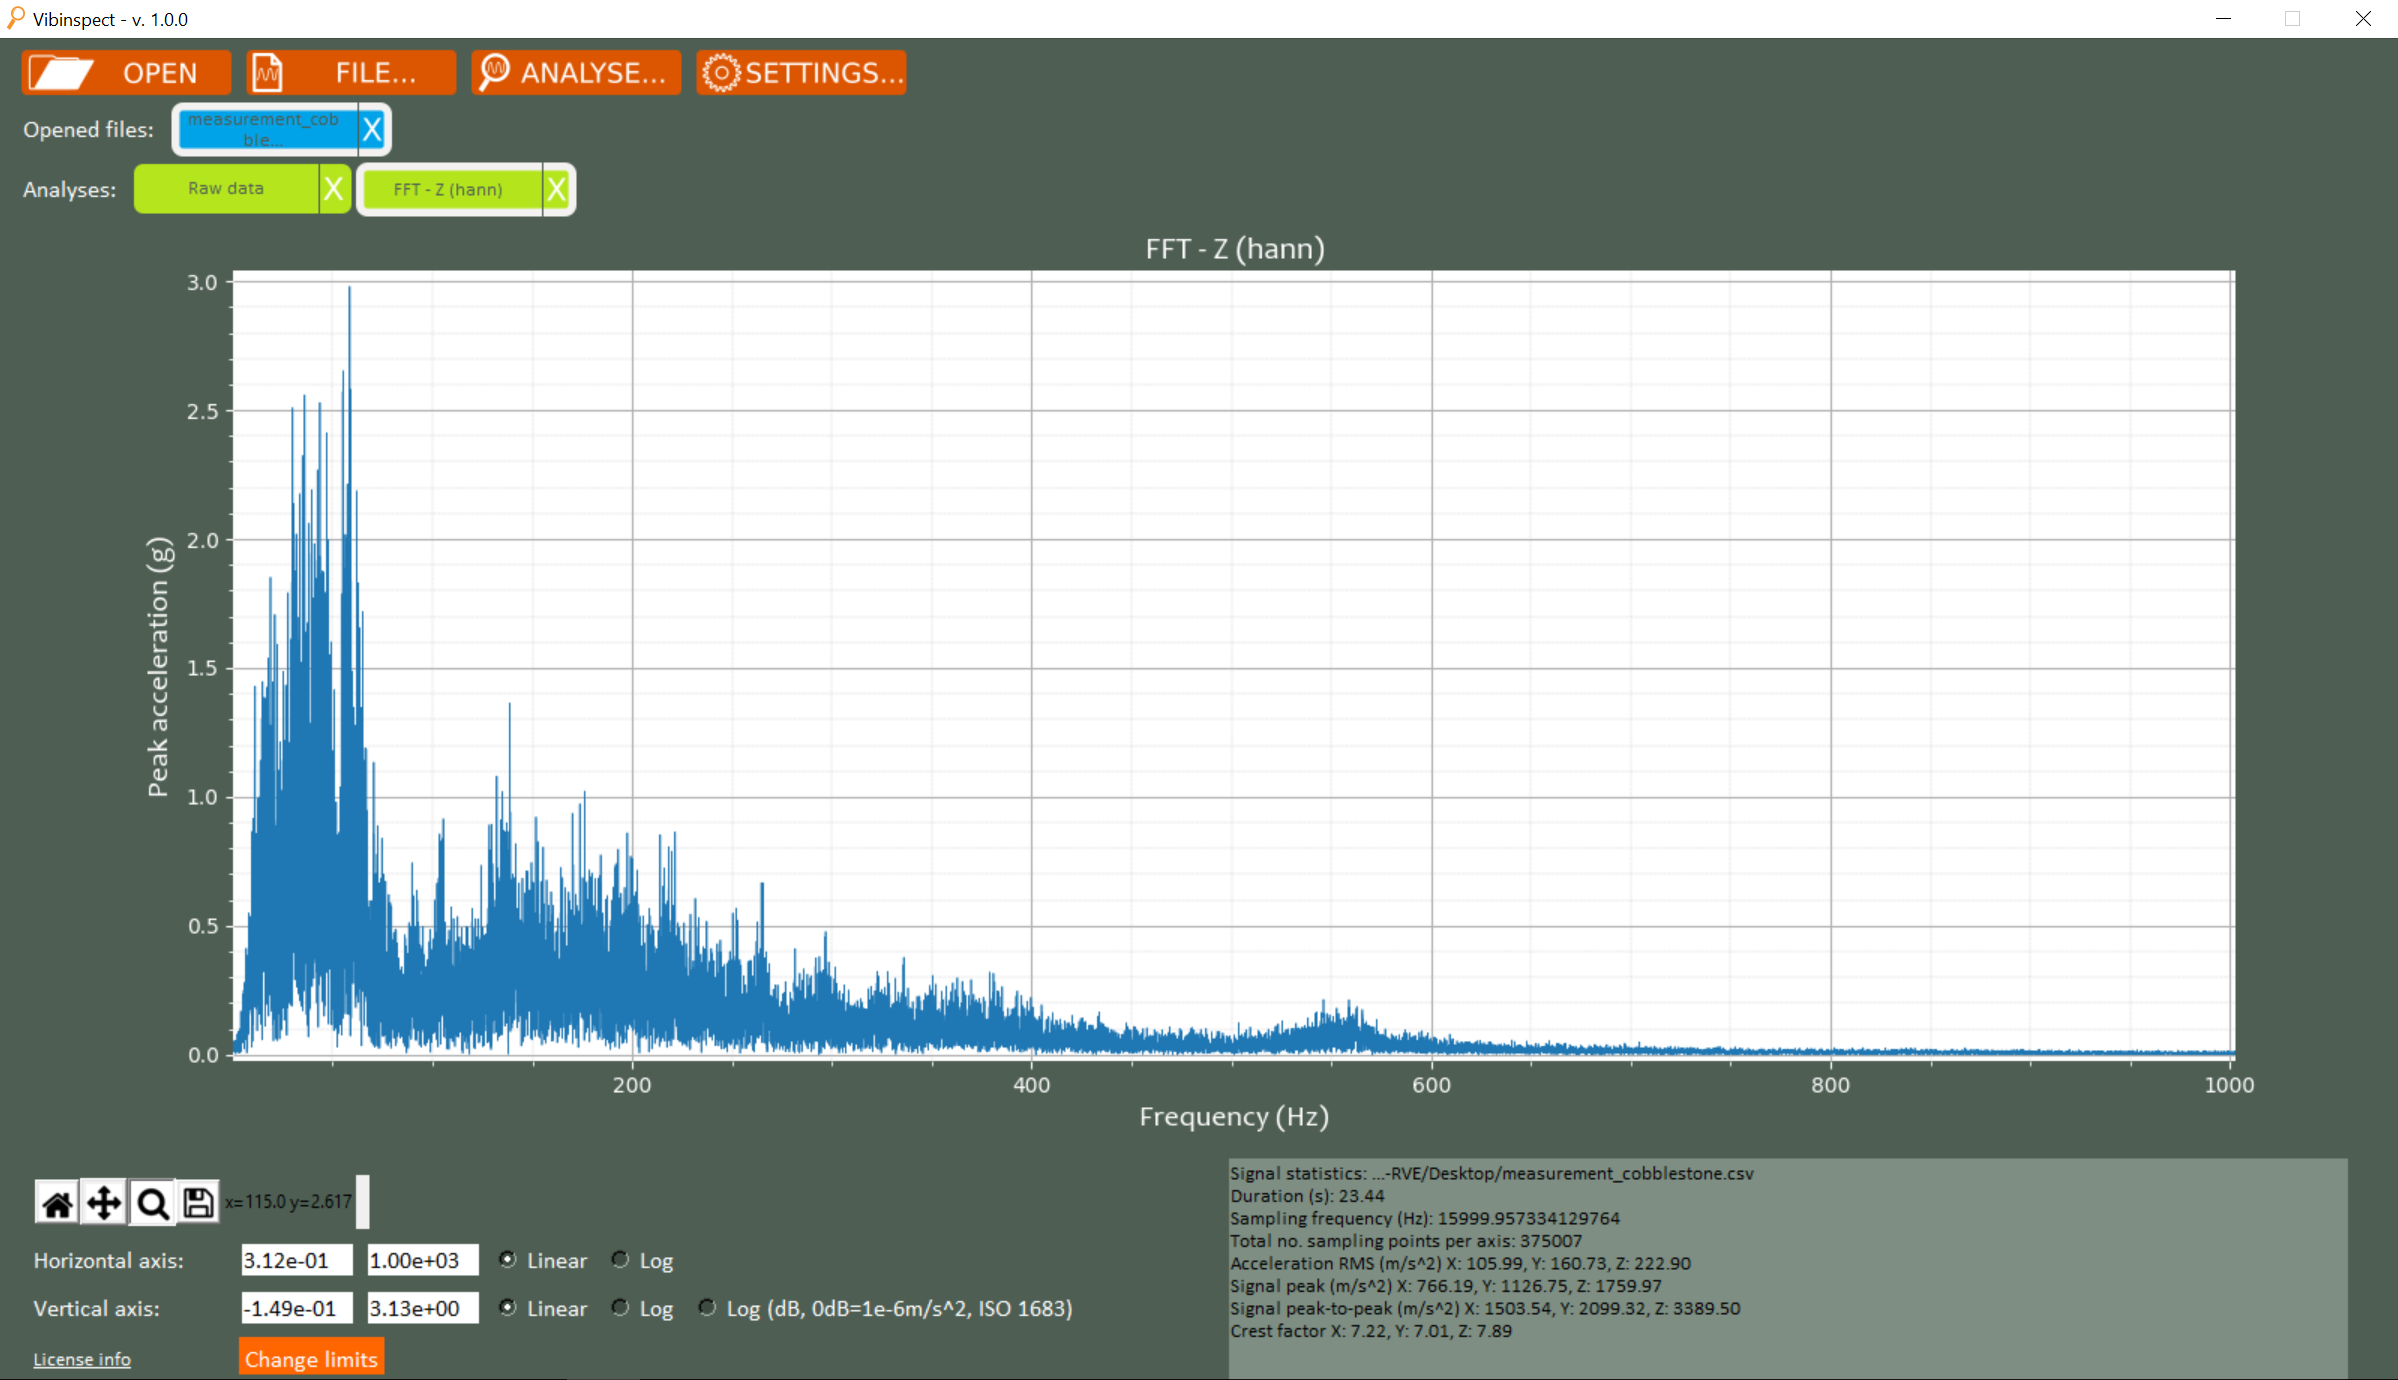
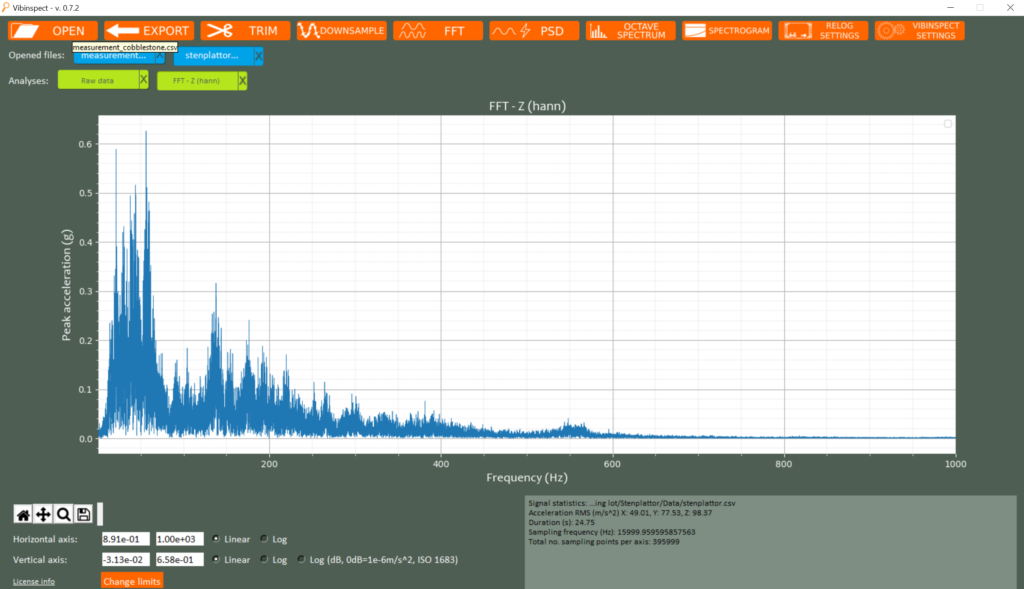
FFT/PSD analysis
FFT & PSD analysis are two of the most useful methods when analysing your vibration data. Understanding how the vibrations are distributed across the frequency spectrums is vital when it comes to identifying potential fault frequencies in a machine.
System requirements
- Windows 10 or later versions
- Memory: 8 GB (minimum), 16 GB (recommended)
- Processor: 64 bit required
Note: It is possible to run the software with 4 GB of memory but please be aware that large files can take some time to load